Reporting
Every channel your school runs, measured in one place.
Canopy Insights brings newsletter results, catalog and flyer reads, phone calls, class enrollment, and Google Business Profile activity into one view—so you can see what is working without opening five different dashboards.
The reporting gap
The numbers already exist. They just live in too many places.
Opens are in the newsletter tool, reads are in the catalog host, calls are with the phone provider, and enrollment is in ASAP. Pulling them together for a board or a monthly meeting takes hours. Insights gathers them every day and shows them side by side, with the same time range and the same comparison for each channel.
- Side by side
- Compared with before
- What needs attention
How Insights works
From scattered dashboards to one clear picture
- 1
Connect the channels you already use
Newsletters from Canopy Community and classes from Canopy ASAP arrive on their own. Canopy connects your digital catalogs and flyers, tracked phone numbers, and Google Business Profile for you.
- 2
See every channel side by side
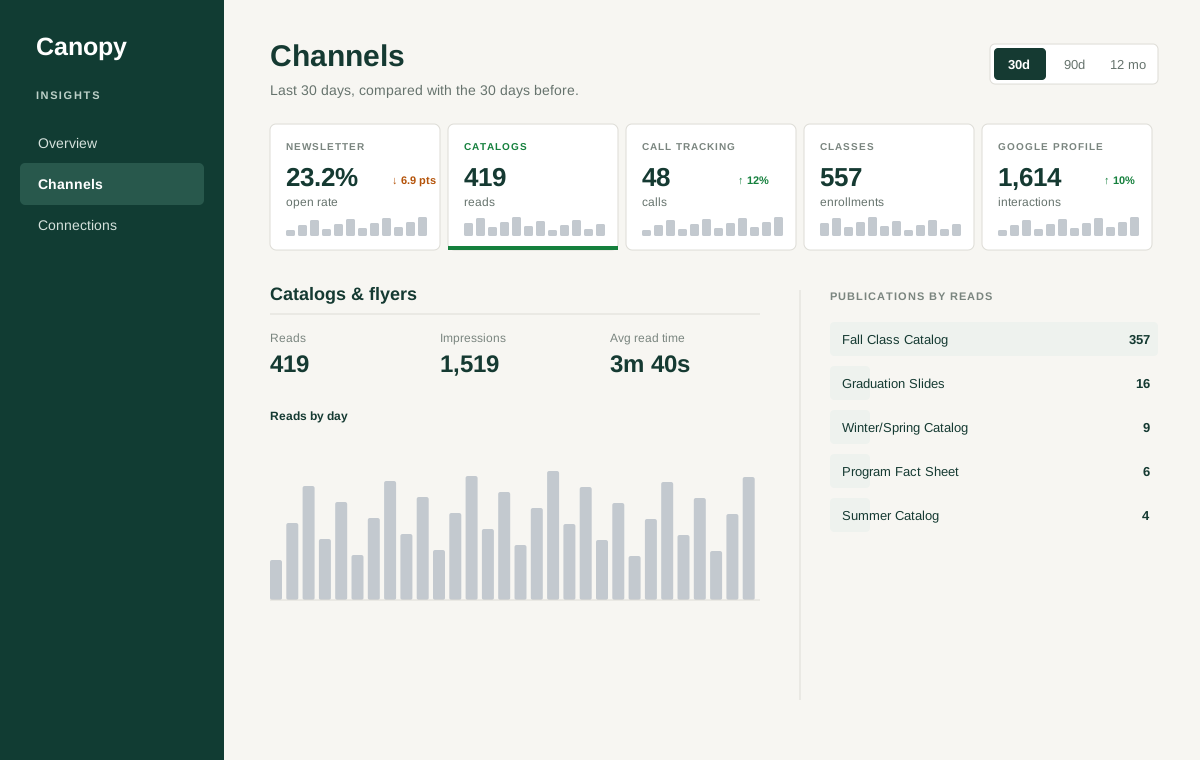
Switch between the last 30 days, 90 days, or 12 months. Every number is compared with the period before, and rates show their change in percentage points.
- 3
Start with what needs attention
The overview opens on what changed: a drop in reads, calls nobody answered, a quiet month without a newsletter, or classes that are filling slowly.
- 4
Open a channel for the detail
See each newsletter's open and click rates, which catalogs people read, where calls came from, how enrollment is moving, and what people searched on Google to find your school.
What changed
Start with what changed—not with a wall of charts
Insights leads with the few things worth your attention this week, each with the number behind it. Every figure has a short explanation of what it counts, so the page reads the same way for a coordinator, a director, or a board member.
Inside Insights
One view of your school's communications
The channels, comparisons, and detail your team needs to see what is working.
- Newsletter open rate, unique opens, clicks, and recipients, calculated the way your newsletter reports them
- Catalog and flyer reads, impressions, clicks, downloads, and read time, by publication
- Call tracking: calls, first-time callers, and unanswered calls by source
- Class enrollment by day and the open sections filling most slowly, from Canopy ASAP
- Google Business Profile interactions, profile views, and the searches that found you
- 30-day, 90-day, and 12-month views, each compared with the period before
Bring your questions to the demo
See your school's numbers in one place
Bring last month's newsletter, catalog, and enrollment questions to the walkthrough, and we will show how Insights answers them.